
Methods
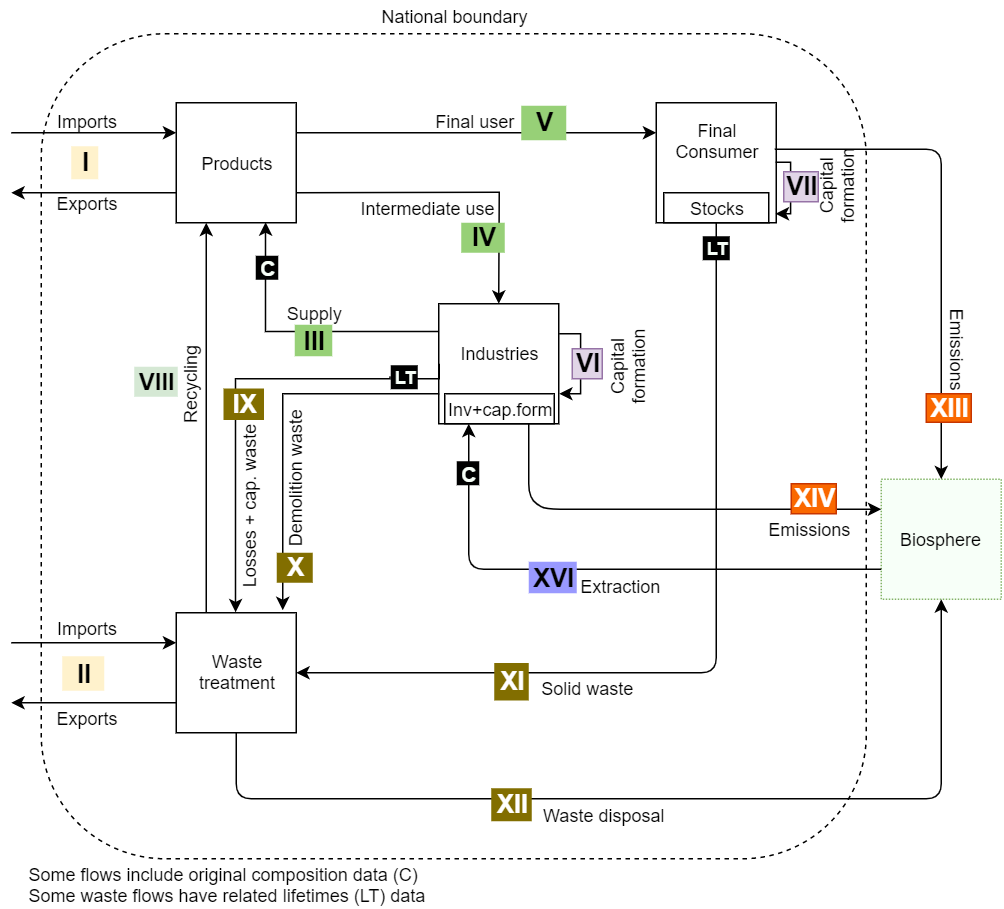
In essence, PANORAMA is a physical environmentally extended multi regional supply and use table (EE MR SUT). It describes the exchanges of total physical matter between various regions, economic sectors, final consumers and the environment on a detailed level (see the Figure 1). On top of that, the project aims to describe the global physical flows of specific elemental materials. Here, we briefly describe the steps performed within the project to deliver such tables.
Data collection
PANORAMA’s SUTs are inherently based on the existing physical EE MSUT, Exiobase v3.4 2011. The core activity here is to collect much more detailed data to disaggregate the existing Exiobase table. A special focus here is given to collect detailed data on product material compositions allowing an accurate representation of flows for various materials of interest. Almost all the data points collected during the project are assigned a data quality score to facilitate more accurate table balancing procedure in the coming steps.
As a result, PANORAMA requires the harvesting and harmonization of the following data sources:
- EXIOBASE v3.4 (aggregated data)
- PRODCOM (detailed production data)
- COMTRADE/BACI (detailed trade data)
- IRP (material extraction data)
- Per-product element (material) content data
- Per-product lifetimes data
- Process-based LCI data (Ecoinvent)
- Consumer expenditure surveys (regional statistical bureaus)
- Waste statistics
- Other projects/systems (PROSUM, MICA, Minerals4EU)
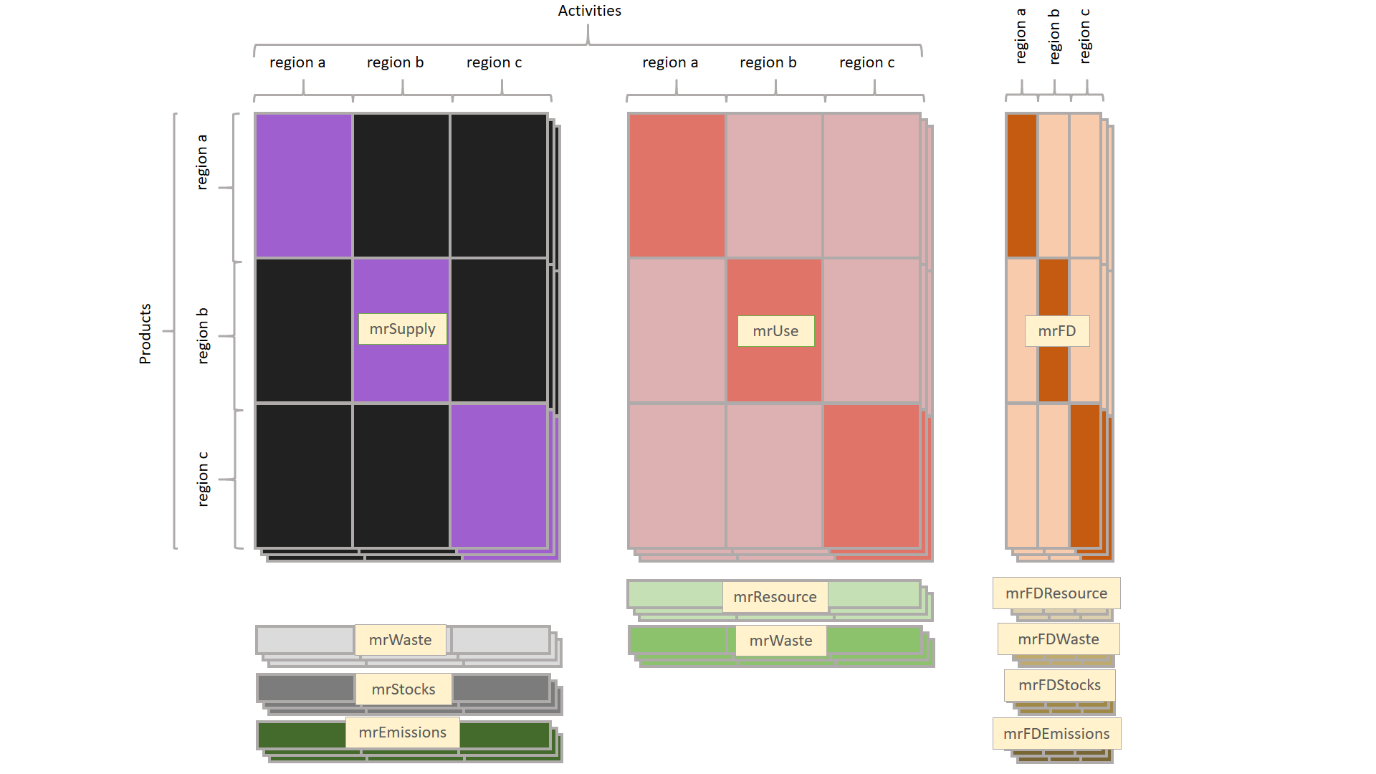
A schematic representation of such is given under the following Figure 2:
For a detailed description see:
Data harmonization
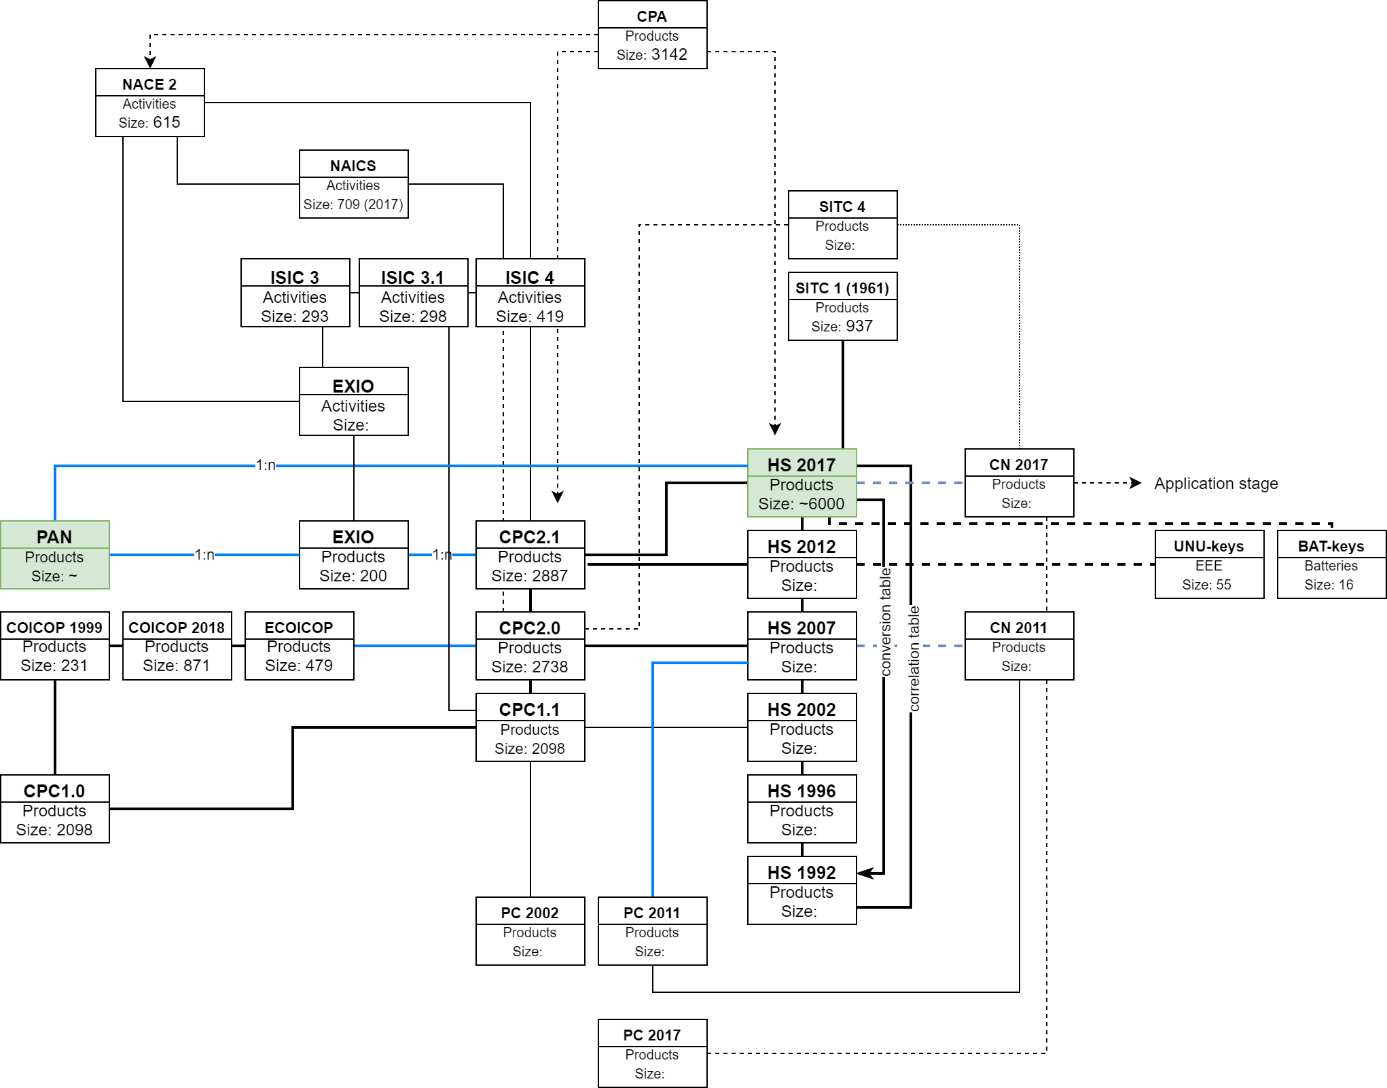
In practice, all the different data sources used describe information using different classifications and measuring units. To be able to bring such data under a common SUT the concordances between such classification have to be delivered. Additionally, multiple conversion factors between different units have to be estimated. Tasks here are performed both in an automatized and manual manner. See the following Figure 3 as for the description of the current classifications in use of the project along with the concordances between such.
For a detailed description see:
- Deliverable D3.2 (in process)
SUT disaggregation and balancing
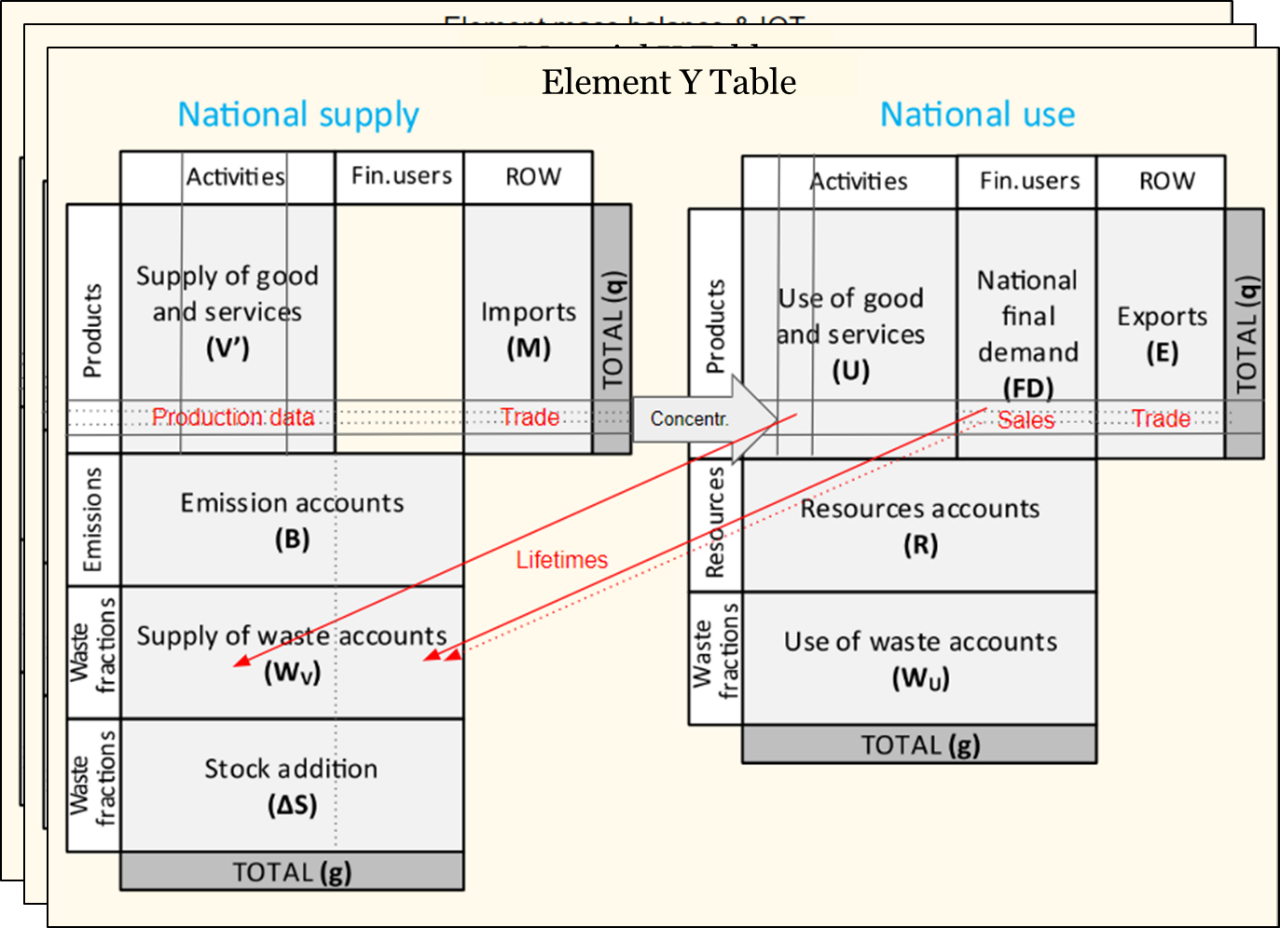
The harvested harmonized data is then used to disaggregate or replace values in the existing Exiobase physical table. Such operation results in a new detailed, however, physically-unbalanced table. The SUT is then balanced using internally devised analytical procedure deriving a balanced physical table for the total mass of products, industries and extensions. Finally, the material composition of the products and of the auxiliary flows is layered on top of the resulting total mass table to derive a set of SUTs for different materials of interest (see Figure 4).
For a detailed description see: